What Profit Target Are You Hitting

Building “A Team”
May 10, 2019
Are You Producing Customers?
May 10, 2019
Are you successful at hitting what you are aiming at? How do you know what target is the one you should be aiming at? Small businesses have always had a challenge with identifying the proper profit target for their business. In fact, many new businesses go out of business before they consistently turn a profit, much less worry about attaining a certain targeted profit amount.
Our LifeLongU™ blog today explores ways a small business owner could focus their aim on different targets of profit. You may be reading this and think, “Isn’t that what all business owners focus on.” I don’t believe they do. Many I have met think about sales first. They become sales driven organizations with processes focused on driving up sales, whatever the cost. They have a philosophy that if we only had more sales, we would make more profits which is very dangerous and can hurt a company as quickly as having no profits can. This way of thinking can create lots of sales activity, lots of risk, lots of cash being funneled through the business and lots of extra loose spending if proper controls are not in place to protect profit margins. It can also create a “feeling” of profitability within your business, which might be false.
Are you clear on what profit you or your business are aiming at? Are you hitting it? Are you sure that is a good goal for your business?
One way to think about it is shown below; looking at Sales and Profits only. It is simple and may quickly tell you what you want to know. But only aiming at top line sales and bottom line profit numbers can get a business owner in trouble. It simply does not tell you what you need to know about how your business is doing and how to fix what might be wrong. This is the simple method (Example 1):
Sales – Cost of sales and “All” other expenses = Profit (what’s left over)
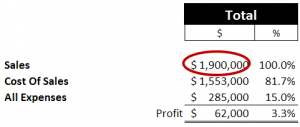
Example 1
A more detailed approached is discussed below:
Again we start with Sales, but this time we break out the sales by product type (You may also think of this as different projects). In our example below, we show three types of product (A – small product, B – large product, C – service, and in your business you may have more).
Next all material costs associated with each individual product type is deducted. This will leave a profit number we will call “Adjusted Profit Contribution.”
Notice in Example 2 product type C – service has the largest amount of sales and is currently contributing the most profit as well (circled in green). Keep watching that as we move through our discussion.

Example 2
We want to track the adjusted profit contribution for each product type after each expense category is deducted from it. This will show us problems we may have with our profit in specific expense category and then we can create potential solutions on how to fix them.
We continue to do this with each expense category, the next one being “labor costs” and continue to view the new “Adjusted Profit Contribution” total. Notice in Example 3 the high labor costs associated with providing product type C – service (circled in green), it no longer is contributing much to our profits.

Example 3
Now we deduct all “overhead allocation costs” associated with a product type. Some products will have larger amounts of overhead (building space, equipment or other costs) associated with it in order to provide that product or service to your customer. Using this method helps to allocate other expenses within your business to a product type. If you chose not to sell that product any longer, you should be able to remove that expense from your business without impacting your other sales.
Notice in Example 4 how the adjusted profit contribution by each product type is slowly decreasing (circled in green), as we deduct expense categories that have only the expenses unique to that product type. You should begin to see what product sales are contributing more profits to your overall business and those are the products we want to aim at selling more of.

Example 4
In the world of accounting and financial statement reporting, after we have deducted the expense categories mentioned above, we are left with our gross profit margin, by product type. This is what we have been working towards by individually breaking apart our sales and costs. We want to understand how much profit each product we sell contributes to our overall profit or bottom line Net Income (before taxes of course).
In our current example, up to this point, it appears that all products contribute profit to our overall gross margin. This in itself is a good sign, but we are not done yet. Let’s continue…
We still have some selling (advertising, marketing, online, literature, etc…) expenses to deduct, by product type. This area is also very important to track. If properly tracked, you should be able to see and understand how your marketing budget and the money being spent on various marketing campaigns and activities is impacting your sales by each product type. Notice in Example 5 the amount of selling costs associated with product type C – service. Our business is spending approximately $80,000 per year in marketing and advertising dollars to generate $800,000 in sales. Is this a good thing? At this point, it’s actually absorbing ($18,000) of our cumulative total adjusted profit contribution.

Example 5
We have one more main category of expenses to deduct and that is general administrative costs. Normally this holds more of the administrative type costs associated with running a business and can be very large or very small, depending how well you have allocated all your cost on products or projects. This could also hold some other large expenses like interest, office rents, depreciation or amortization, insurance, etc… (Some of these should get allocated out by product type and appear in the Overhead Allocation Costs area above, as applicable).
As we look at Example 6 below, you will see that product type C – service also has some cost associated with it in this category. It now is absorbing a cumulative total ($58,000) of adjusted profit contribution. To think of this another way, if the company were to get rid of product type C – service and the $800,000 of sales, it would gain $58,000 of profit each year. But in the real world, it usually does not work so cleanly. There may be many reasons an owner or business may want to keep those sales within the company. For instance, the service sales may be generating most of the small product sales from product type A. A business owner should be aware of why they have sales and expenses at the levels they do, what needs to be changed and how to change it.

Example 6
By now you should be able to see why we want to break down our profit and loss statement to show the details of what is really happening within our business. It is not just a simple task of aiming for a certain budgeted top line sales number or a bottom line profit number. Even when we hit what we are aiming at, that may not be in the best interest for us or our business.
When breaking out the sales and costs in detail, we can pick other targets for us to aim at, like:
- Sales dollars by product type
- Material costs, labor costs and overhead allocation cost, as a percent of sales, by product type
- Gross margins $ and %
- Selling costs associated by product type
- General administrative cost associated by product type
- and this is just the start…there is much more…
When looking at the bigger picture of our business, we can quickly decide on a new target, adjust our internal processes, take aim and fire. Then validate the affect our change has made on our business.
Take good aim at the right target!
Gary J Kiecker
